WAVE VIEWING
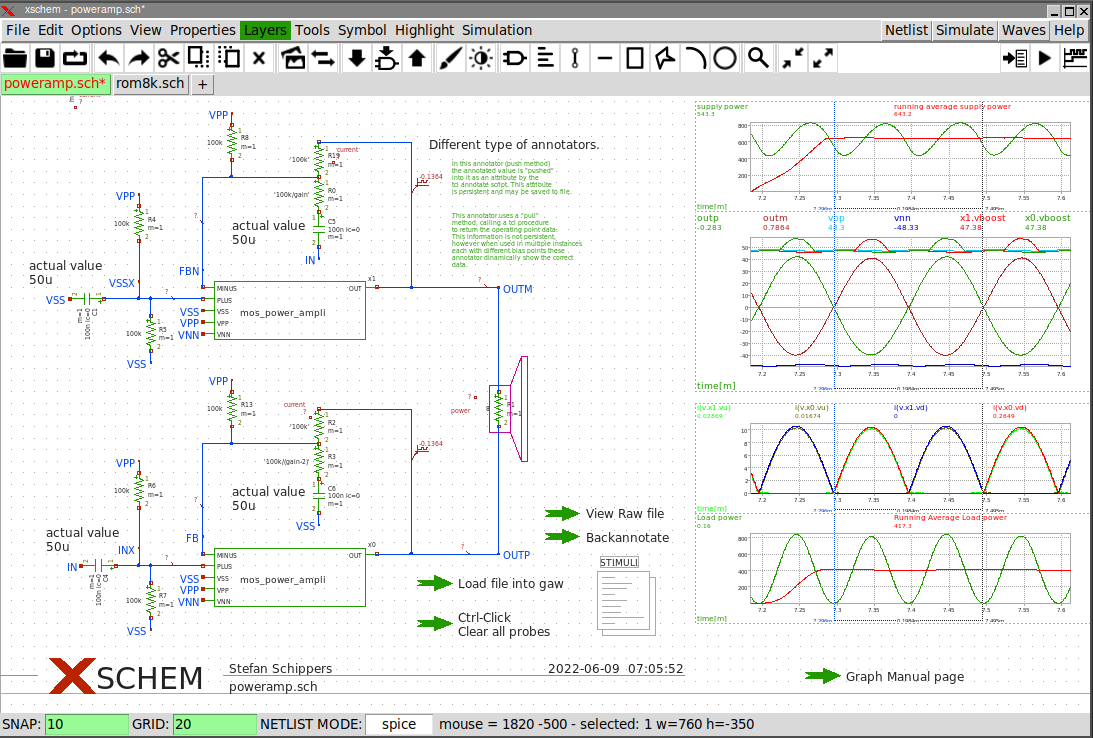
Spice simulation data can be viewed directly in Xschem.
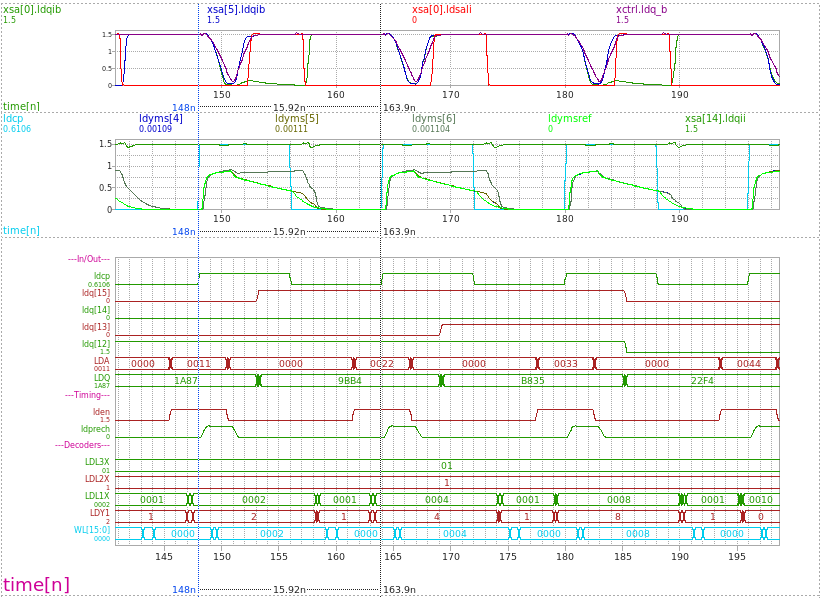
- Overlayed and stacked analog / digital waveforms, cross-probing of nodes into graph
- Simple RPN notation for entering waveform expressions (average, power, derivative,...)
- Cursors for time / delay / amplitude measurements
- Graph configuration (zoom, waveforms, colors) is saved with the schematic